This article was originally written in Russian. It is intended for system administrators and software developers. I have tried to adapt it for this audience.
How to Read Logs When There Are Too Many of Them
The era of monoliths is over, and today logs often confuse more than they help. Multiple services, multiple log files, and lines that seem to contradict each other — there is no obvious root cause in this monotonous investigation. But the search area can be narrowed down, and the answer is almost always found in the chain of events.
Commands, life hacks, and a list of utilities are under the cut. A quick warning: this article is quite long, so you can jump straight to Linux, Windows, or the tools section at the very end.
What Are Logs?
As usual, I’ll start with a bit of theory for beginners. A log is a chronological record of events that a system, application, or individual service considered important.
Logs are usually used to understand which user sent a request, which process crashed, which service did not respond, where an error appeared, and what the system managed to do before the failure occurred.
Below is the English translation of the passage, preserving the structure and nuances while ensuring clarity and a professional tone suitable for experienced administrators and developers:
Logs can be system-level, server-side, application-specific, mail-related, authentication and authorization journals, database logs, container logs, proxy logs, load balancer logs, and logs from network equipment. For convenience, they are typically grouped by source.
When a user encounters a 502 error, it makes more sense to start by inspecting the Nginx logs or the application logs rather than sifting through a full system journal for the past 24 hours. If SSH login doesn’t work, the first places to check are auth.log, secure, or the security event logs on Windows. If a service suddenly dies, you’ll need to look at the application’s own log, the service manager’s entries, and system events that occurred around the time of the crash.
Next up: importance levels. Without them, a log quickly resembles a wall of Matrix-like text. Each message has a severity level:
- INFO describes normal operation.
- DEBUG helps a developer see execution details.
- WARN warns about a potential problem.
- ERROR records an error.
- FATAL and CRITICAL indicate a critical state or an error that seriously disrupts the system or component.
There is also TRACE, where the application logs a very detailed execution path: method calls, transitions between components, parameters, and internal states. In production, this level is usually enabled cautiously, because it rapidly turns the disk into a consumable resource.
Open: Logs_admin_pic003_en.png
A special joy for developers and a recurring headache for administrators is the stack trace — the chain of calls that led the application to a failure. It shows where the problem surfaced, but the actual cause may be in a different layer, so it should be treated carefully.
Where to Start the Analysis
When everything is already on fire, the first thing everyone looks for is error. Sometimes this helps, but more often it leads straight into the weeds. I recommend starting with a search frame. For example, define:
- when the degradation started,
- where it became visible,
- which component is closest to the symptom,
- which logs belong to this specific chain of events.
If monitoring shows a rise in 5xx errors starting at 14:32, there is no point in reading the entire access.log for the whole day. Take a time window around 14:32 and check the incoming traffic, application errors, service state, and system events around that timestamp.
A better approach is to follow this chain: symptom, the component closest to it, dependencies, and then the system layer. For example, when a website starts returning errors, you can go from Nginx to the application, then to the database, queue, DNS, file system, and kernel.
How to Build One Story from Multiple Sources
I’ll explain how to read logs when there are too many of them using Linux and Windows as examples. I’ll also cover a couple of life hacks for containerized environments separately.
Linux
Let’s start with Linux, because this is where you most often have to work over SSH. Logs are usually located in /var/log/, but the exact paths depend on the distribution and the service.
In Debian and Ubuntu, system messages can usually be found in /var/log/syslog, while authentication logs are stored in /var/log/auth.log. In RHEL, CentOS, AlmaLinux, and Rocky Linux, you will more often see /var/log/messages and /var/log/secure.
Nginx logs are usually located in /var/log/nginx/, Apache logs in /var/log/apache2/ or /var/log/httpd/. PostgreSQL and MySQL may write either to their own directories or to journald, depending on how the service is configured.
If the system uses systemd, I would start with journalctl, because it can already filter records by service, time, PID, boot, and severity level. In other words, it does not force you to manually fish the right line out of a general swamp of log entries.
For example, to view the last 200 lines of a specific service, replace myapp.service with the name of your unit:
journalctl -u myapp.service -n 200 --no-pagerIf the service is called nginx, the command will look like this:
journalctl -u nginx -n 200 --no-pagerThe -n 200 option shows the last 200 records. If the service writes rarely, -n 50 may be enough. If it is noisy, use -n 1000. The --no-pager option disables paged output, so the result appears directly in the terminal or can be passed further down the pipeline.
If the incident time window is known, it is better to limit the output by time immediately. For example, the degradation started on March 14, 2025, around 21:00, and by 21:30 the service had already recovered:
journalctl -u myapp.service --since "2025-03-14 21:00" --until "2025-03-14 21:30" --no-pagerFor live monitoring of a service, use -f, similar to tail -f:
journalctl -u myapp.service -fIf you only need warnings and errors, add a priority filter:
journalctl -u myapp.service -p warning..alert --since "1 hour ago" --no-pagerHere, warning..alert filters out regular informational messages. This is useful when a service writes a lot of INFO entries. But remember: sometimes the cause is hidden exactly in a normal-looking line right before the error.
If the service crashed after a reboot, or if the issue may have occurred during the previous boot, it is useful to compare the current and previous boot logs:
journalctl -b -u myapp.service --no-pager

journalctl -b -1 -u myapp.service --no-pager
Here, -b shows the current boot, and -b -1 shows the previous one. This helps when the symptom disappears after a reboot, but the cause remains in the previous journal.
Kernel messages should be checked separately. This is necessary when you suspect the OOM Killer, disk issues, file system problems, a network interface, or a driver:
journalctl -k --since "1 hour ago" --no-pagerA quick filter for common keywords in such cases:
journalctl -k --since "1 hour ago" | grep -Ei 'oom|killed process|segfault|ext4|xfs|nvme|i/o error|link is down|reset'If you see Killed process, the process terminated by the OOM Killer will usually appear nearby. If you see I/O error, nvme reset, or file system errors, the problem may already be below the application layer.
When journald is no longer enough and you are dealing with a regular file, old-school log analysis begins. With plain log files, searching with context is very useful. You do not just find the matching line — you immediately see what happened before and after it:
grep -n -A20 -B10 'timeout' /var/log/myapp/app.logReplace timeout with an IP address, login, request ID, error code, or part of the message. -A20 shows 20 lines after the match, -B10 shows 10 lines before it, and -n adds line numbers. If the event is short, -A5 -B5 may be enough. If you need to see a longer chain, use something like -A50 -B20.
To search case-insensitively, add -i:
grep -ni -A10 -B10 'exception' /var/log/myapp/app.logIf you need to search through a whole directory of logs instead of a single file:
grep -Rni --include='*.log' 'timeout' /var/log/myapp/The --include='*.log' option prevents grep from digging through temporary files and everything else that accidentally happens to be nearby.
If the logs have already been compressed after rotation, use zgrep:
zgrep -ni 'timeout' /var/log/myapp/app.log*.gzIf the timestamp format in the log is clear, do not read the entire day. For example, if entries start with 2025-03-14 21:05:... and you need the whole 21st hour:
grep '^2025-03-14 21:' /var/log/myapp/app.logIf you need a minute range, for example from 21:10 to 21:19:
grep '^2025-03-14 21:1[0-9]:' /var/log/myapp/app.logFor the current file, use tail. If you want to see the last 500 lines and continue watching new entries, adjust the number depending on how noisy the service is:
tail -n 500 -f /var/log/myapp/app.logIf the file is rotated, -F is better, because it will continue following the new file after the old one is renamed:
tail -n 500 -F /var/log/nginx/error.logAccess logs are especially tricky. They look like an endless queue of identical lines, but they become useful when aggregated. It is better to turn them into counters immediately. For example, to see the most frequent IP addresses in Nginx:
awk '{print $1}' /var/log/nginx/access.log | sort | uniq -c | sort -nr | head -20head -20 shows the first 20 results. If you need a wider list, change it to head -50.
If you have a non-standard access log format, first check a few lines:
head -3 /var/log/nginx/access.logIf the last field in the Nginx log_format contains $request_time, you can view the slowest requests like this:
awk '{print $NF, $7, $9}' /var/log/nginx/access.log | sort -nr | head -20If the request time is stored elsewhere in your log, first check the logging format:
grep -R "log_format" /etc/nginx/nginx.conf /etc/nginx/conf.d/The logic for authentication logs is the same. Do not read everything line by line — collect targeted samples right away. For example, on Debian and Ubuntu, failed SSH logins can be viewed with:
grep 'Failed password' /var/log/auth.log | tail -50On RHEL-like systems, use:
grep 'Failed password' /var/log/secure | tail -50One of the most useful Linux tricks is to always search for a request ID, trace ID, or correlation ID if one exists. These identifiers make it much easier to reconstruct the path of a single request through Nginx, the application, the queue, and the worker:
grep -Rni 'request_id=abc123' /var/log/myapp/If the identifier looks like a UUID, you can first check which IDs appear most often:
grep -oE '[0-9a-fA-F]{8}-[0-9a-fA-F]{4}-[0-9a-fA-F]{4}-[0-9a-fA-F]{4}-[0-9a-fA-F]{12}' /var/log/myapp/app.log | sort | uniq -c | sort -nr | head -20After that, take the suspicious ID and inspect it with context:
grep -n -A30 -B10 'abc123' /var/log/myapp/app.logIf the logs do not contain an end-to-end identifier, that is already a separate conclusion after the investigation. It should be added; otherwise, every distributed system will keep turning into archaeology.
Windows
If in Linux “everything is a file” — and usually a text file — then Microsoft’s logging architecture historically went in the direction of strict structuring and binary formats. The transition to Event Tracing for Windows, or ETW, and XML schemas made it impossible to parse logs simply with grep or Notepad. Instead, it forces you to understand PowerShell and the architecture of Windows event logs more deeply.
For proper forensic analysis, you need to know exactly where the operating system physically stores its artifacts:
-
Classic system logs such as
System,Application, andSecurity, along with hundreds of specialized service logs, are stored inC:\Windows\System32\winevt\Logs\in.evtxformat. -
IIS web server logs are stored in
%SystemDrive%\inetpub\logs\LogFiles\orC:\Windows\System32\LogFiles\. The directories inside are named according to theW3SVC1,W3SVC2pattern, where the number corresponds to the internal site ID in the IIS console. -
Starting with Windows 10, Windows Update stopped writing to the simple text file
C:\Windows\WindowsUpdate.log. Its ETW telemetry is now continuously written to binary.etlfiles hidden inC:\Windows\logs\WindowsUpdate.
The main rule is the same as in Linux: first narrow down the sample, then read it.
The main logs are as follows: System for system events and services, Application for applications, Security for logon auditing and security-related actions, plus separate logs for applications and Windows Server roles. If a service crashes, start with System and Service Control Manager. If an application crashes, check Application. If the issue is related to login, permissions, or suspicious activity, you need Security, although administrator rights are often required for it.
It is also important to note that for many years the main PowerShell cmdlet for extracting events was Get-EventLog. However, its architecture is hopelessly outdated. Today, it works only with old classic logs, uses deprecated Windows APIs, and, most critically, is highly inefficient when filtering data.
Microsoft recommends using Get-WinEvent. With it, filtering is performed on the Event Log service side. For maximum speed, Get-WinEvent offers two filtering mechanisms: FilterHashtable and FilterXML.
Now to the commands. To view system events from the last 30 minutes, use:
Get-WinEvent -FilterHashtable @{LogName='System'; StartTime=(Get-Date).AddMinutes(-30)}If you need two hours instead of 30 minutes, replace AddMinutes(-30) with AddHours(-2):
Get-WinEvent -FilterHashtable @{LogName='System'; StartTime=(Get-Date).AddHours(-2)}Application log errors from the last two hours:
Get-WinEvent -FilterHashtable @{LogName='Application'; Level=2; StartTime=(Get-Date).AddHours(-2)}Level=2 means errors, Level=3 means warnings, and Level=4 means informational events.
If you need errors and warnings together, you can filter a short sample like this:
Get-WinEvent -FilterHashtable @{LogName='Application'; StartTime=(Get-Date).AddHours(-2)} |
  Where-Object {$_.LevelDisplayName -in 'Error','Warning'}
To view a specific event ID, for example an application crash with Event ID 1000, use:
Get-WinEvent -FilterHashtable @{LogName='Application'; ID=1000; StartTime=(Get-Date).AddHours(-2)}Service Control Manager events, which help you understand when a service started, crashed, or was stopped, can be viewed like this:
Get-WinEvent -FilterHashtable @{LogName='System'; ProviderName='Service Control Manager'; StartTime=(Get-Date).AddHours(-2)}However, to make the output readable, keep only the time, ID, source, level, and message:
Get-WinEvent -FilterHashtable @{LogName='System'; StartTime=(Get-Date).AddMinutes(-30)} |
  Select-Object TimeCreated, Id, ProviderName, LevelDisplayName, Message |
  Format-List
For the Security log, you can check failed logons from the last hour. For example, Event ID 4625 means a failed logon:
Get-WinEvent -FilterHashtable @{LogName='Security'; ID=4625; StartTime=(Get-Date).AddHours(-1)} |
  Select-Object TimeCreated, Id, ProviderName, Message |
  Format-List
For text logs, PowerShell works almost like tail:
Get-Content .\app.log -Tail 200 -Wait-Tail 200 shows the last 200 lines. If you need a short tail, use 50; if the log is noisy and you need to capture the moment before the error, use 1000. -Wait keeps waiting for new lines.
You can also search through a text log:
Select-String -Path .\app.log -Pattern 'timeout|exception|failed'Or through a directory:
Get-ChildItem C:\Logs -Recurse -Filter *.log |
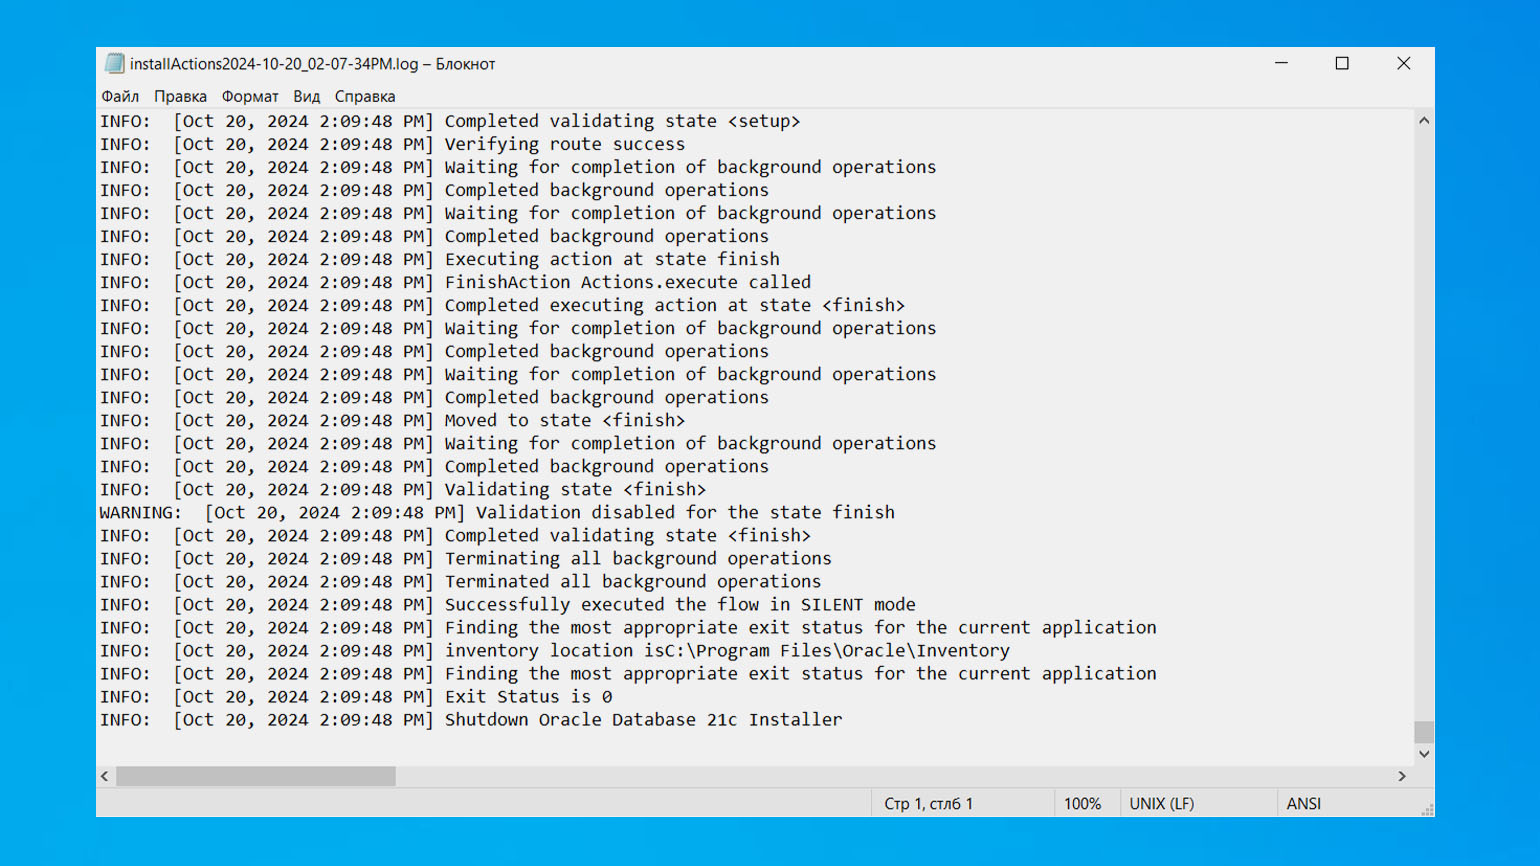
Select-String -Pattern 'timeout|exception|failed'The main Windows life hack is simple: do not open a huge log in Notepad, and do not export the entire Event Log without filtering. For Event Log analysis, use FilterHashtable, because server-side filtering is much more efficient.
Important! It is practically IMPOSSIBLE to cover all commands in one article. So if you are a beginner, currently learning, or your system has just crashed and you are frantically looking for a way out in this article — I apologize and recommend looking for the answer in tutorials, books, a search engine, or a chatbot. I wrote this material only as a reminder of the basics of working with large volumes of logs.
What Actually Saves Time During Analysis
Habits save time.
- Narrow the sample before reading. In Linux, this means
journalctl --since,--until,-u,-p,_PID. In Windows, useGet-WinEvent -FilterHashtable. The more precise the first slice is, the less noise you have to keep in your head. - Count repetitions. A single
errormay just be background noise, but a thousand identicaltimeoutmessages within five minutes already look like a symptom. That is whysort | uniq -c | sort -nris often more useful than reading a file from top to bottom. - Look at the context. Commands without
-A,-B, or-Coften give too little information, because in logs, the important part is not only the line with the error, but also what happened before it. For example: a new deployment, database reconnection, connection reset, configuration change, or worker restart.
Open: Logs_admin_pic004_en.png
-
- Check log rotation and old instances. In Linux, the error may have already moved into a
.gzfile. In Windows, it may be stored in a different event log.
- Check log rotation and old instances. In Linux, the error may have already moved into a
- Save the course of the investigation. When there are too many logs, your memory starts filling in the gaps with a convenient version of events. Write down the time of the first symptom, the commands you have already run, suspicious messages, and hypotheses that were not confirmed. An hour later, this will save you from checking the same thing twice.
And the boring but important sixth habit: add proper logging fields to your applications. A timestamp in a unified format, severity level, service name, instance, request ID, user ID without personal data, endpoint, duration, response status, and trace ID save more time than any fancy log viewer.
Top Tools for Reading and Analyzing Logs
However, for decoding complex and large-volume log records, it is better to use ready-made and accessible tools. For example, free local utilities:
- lnav — a console-based log viewer. It can open multiple logs at once, read archives, recognize formats, build a timeline, and run SQL queries against log files.
- ripgrep — a fast recursive search tool for files. It works on Linux, macOS, and Windows, and is convenient for large directories with logs and source code.
- jq — a utility for working with JSON. It is especially useful for containers and modern applications that write structured JSON logs.
- Klogg — a graphical viewer for large log files. It is suitable for gigabyte-sized files that cannot be opened properly in a regular text editor.
- LogExpert — a Windows utility for viewing logs. It supports tailing, filters, highlighting, tabs, and plugins. It is convenient for application logs in a graphical interface.
- Log Parser 2.2 — another Windows utility with SQL-like queries. It is useful for IIS, Event Log, CSV, XML, and text logs, especially in older Windows infrastructures.
For centralized log collection, more serious tools can help:
- Grafana Loki — a system for storing and searching logs. The self-hosted version is free, while Grafana Cloud offers both a free tier and paid plans based on data volume. It is well suited for Kubernetes and microservices because it actively uses labels and does not index the entire text like classic full-text systems.
- SigNoz — an observability platform for logs, metrics, and traces. The self-hosted version is free, while cloud plans are paid. It is convenient in environments that use OpenTelemetry and need to link a log entry to a request trace.
- Elastic Stack / ELK — a stack for collecting, storing, and searching logs based on Elasticsearch, Logstash or Beats, and Kibana. Free features are available in the self-managed version. It is strong in full-text search, analytics, and large volumes of unstructured data.
- Graylog — a platform for centralized log management. It is suitable for infrastructure logs, network devices, applications, alerts, and event streams.
- Splunk — a commercial platform for centralized event collection and search. Pricing depends on data volume and the selected edition. It is strong in its search language, security, auditing, and investigation of complex incidents.
Instead of a Conclusion
I will repeat it once again: when there are only a few logs, you simply need to find the right line, and the case is almost closed. When there are many logs, you have to look for patterns. That is why proper analysis does not start with error, but with time, source, context, and a short timeline.
Console commands are still indispensable in this story, but if the system is distributed, logs need to be collected centrally.